In this blog post, we celebrate TRIO Day 2026 and reflect on the history and success of the programs. This article will examine the TRIO mandate and present data demonstrating the effectiveness of TRIO programs, drawing on the Pell Institute’s 2024 Indicators of Higher Education Equity Historical Trend report (Cahalan et al., 2024). In the next blog post, to be released on Tuesday, March 3, I use data to take a sober look at major trends that have shaped and will continue to shape the context for TRIO’s future work. This data reveals the increasingly challenging national and global context in which TRIO will continue to serve low-income, first-generation, and students with disabilities as we enter the second quarter of the 21st century.
TRIO Congressionally Defined Mandate
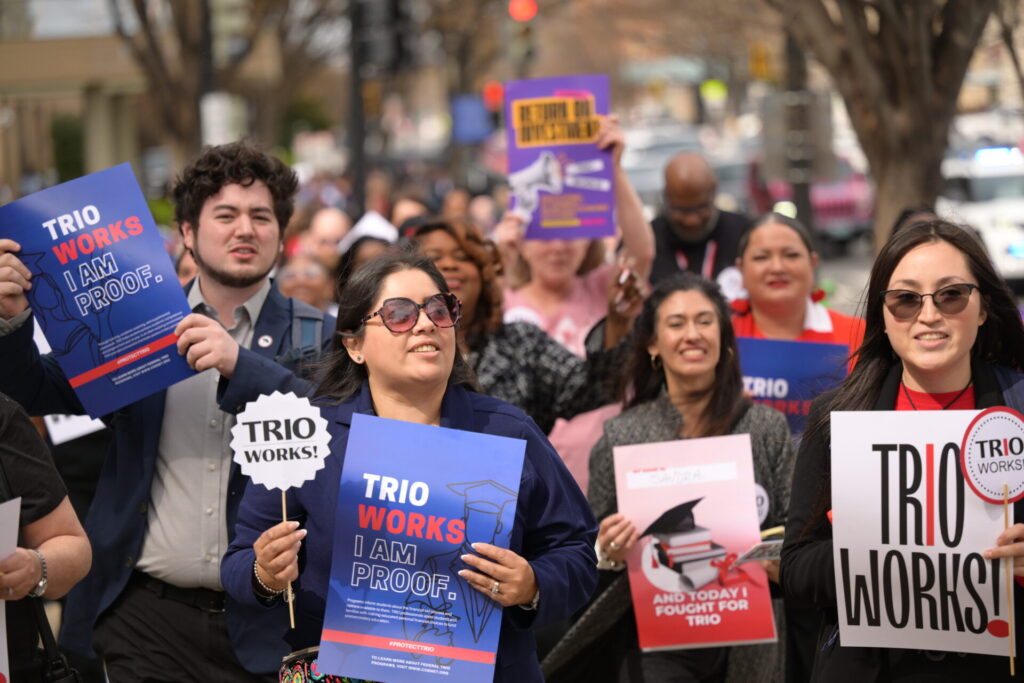
The Federal TRIO Programs, first begun by an act of Congress as part of the 1965 Higher Education Act, were the first set of national college access and retention programs to acknowledge, and begin to address and mitigate, the role of socioeconomic disadvantages in the postsecondary education system of the USA. By 2026, there were over 3, 300 TRIO programs at over 1,000 institutions yearly serving 817,000 students from middle school through adult education.
Throughout the 60 year period since Congress first authorized the program, the TRIO community has worked with Congress through eight major reauthorizations (the last being in 2008) and yearly appropriations to ensure need-based, feasible and accountable practices and procedures to best fulfill TRIO’s congressionally defined mission. As such TRIO has had an impactful leadership role in developing successful models of service for low-income, first-generation college and students with disabilities that can work in every state and territory and have served as models worldwide. TRIO programs have represented a congressionally mandated national commitment to widening participation in higher education throughout the United States.
TRIO Effectiveness
Although funding levels have never been high enough to permit TRIO programs to serve more than 2 to 5 percent of eligible students in any given year (Equity Indicator 7b(iii)), national evaluations have found TRIO programs are consistently effective in fostering degree attainment for low-income and first-generation students served. For example, in the 1990s, at a time when only 6 out of 100 students nationally in the lowest-income quartile could expect to obtain a bachelor’s degree by age 24 (Equity Indicator 5a(i)), the intensive Upward Bound program was able to raise this probability to 21 out of 100.
The same study also found that participation in a light touch TRIO program such as Talent Search was able to raise the chance for BA completion from 6% to 15% (Cahalan & Goodwin, 2014). SSS (Student Support Services) programs have also been shown to significantly increase retention and completion among those already enrolled in college. For example, second year retention among SSS participants was found to be significantly higher than a comparable sample from the Beginning Postsecondary Study (BPS) (Zeiser et al., 2019). At 2-year institutions SSS participants had a 74% second year retention compared to 63% for comparable non-participants, and at 4-year institutions SSS participants achieved a 93% retention compared to 84% for comparable non-participants.
The same study found that SSS participants at 4-year colleges had a 51% 6-year completion rate, compared to a 43% rate for a matched comparison group, and that 46% of SSS participants at 2-year institutions completed an associate degree or certificate or transferred to a four-year institution within 4 years compared to 31% for a matched non-participant comparison group (Zeiser et al., 2019).
Facing The Challenges Ahead
Despite TRIO’s proven effectiveness over the past 60 years, funding levels have never been high enough to serve more than a fraction of the students eligible for services. As we will discuss in our next blog, since the time TRIO was first introduced, inequality in the United States has increased substantially so that by 2022 the top 20 percent of households have 52% of household income (up from 44% in the period of TRIO’s initiation), and the lowest 40 percent have but 11% percent of income (down from 15% in 1967) (Indicators (SettingThe Stage (STS Figure 8c).
Pell grants, originally intended to cover three-fourths to two-thirds of costs (Mensel, 2013), have fallen from 67% in 1980 to cover only 25% of average college costs by 2022-23(Equity Indicator 3b(ii)). At a time when higher education participation is rapidly increasing worldwide, the United States fell from 2nd in 2002 in bachelor’s degree attainment among 24- to 35-year-olds to 18th in 2022 (Equity Indicator 6a). These conditions indicate that the need for TRIO services for low-income, first-generation, and students with disabilities is now higher than ever before. In recent years, legislation, such as the Pell Grant Preservation and Expansion Act, has been introduced in hopes of creating feasible ways to address these issues, including doubling of Pell Grants and subsequently indexing Pell to inflation.
The bills also provided for additional TRIO funding to enable doubling the number of students TRIO can support. These bills have strong advocacy support from major education associations. In these challenging times it is important not to lose sight of these ambitious proposals so that TRIO can fulfill its congressional mandate to ensure that low income, first-generation and students with disabilities have a realistic opportunity for access and success in higher education.
References
Cahalan, M. W., Brunt, N., Vaughan, T., III, Montenegro, E., Breen, S., Ruffin, E., & Perna, L. W. (2024). Indicators of higher education equity in the United States 2024: 50-year historical trend report. https://www.pellinstitute.org/the-indicators-of-higher-education-equity-in-the-united-states-2024-50-year-historical-trend-report/
Cahalan, M. W., & Goodwin, D. (2014). Setting the record straight: Strong positive impacts found from the national evaluation of Upward Bound re-analysis documents significant positive impacts masked by errors in flawed contractor reports. Pell Institute for the Study of Opportunity in Higher Education – Council for Opportunity in Education. https://www2.ed.gov/about/offices/list/ope/trio/sssparticpantsinbpsls.pdf
Mensel, F. (2013). Birth of the Pell Grant: The community college role. In Reflections on Pell. Pell Institute for the Study of Opportunity in Education – Council for Opportunity in Education.
Zeiser, K. L., Heuer, R., & Cominole, M. (2019). Comparing student outcomes between Student Support Services participants and nonparticipants in the 2004/09 Beginning Postsecondary Students Longitudinal Study. U.S. Department of Education. https://www2.ed.gov/about/offices/list/ope/trio/sssparticpantsinbpsls.pdf
Margaret Cahalan is a Senior Research Fellow at the Pell Institute for the Study of Opportunity in Higher Education. All views expressed in this Blog Post are the full responsibility of the author and do not represent those of the Pell Institute or the Council for Opportunity in Education.