
In this blog post, we celebrate TRIO Day 2026 and examine some challenges that lie ahead for first-generation and low-income students. This article uses data from the Pell Institute’s 2024 Indicators of Higher Education Equity Historical Trendto examine major trends that have formed and will form the context for the future work of TRIO. This data reveals a challenging national and global context in which TRIO will continue to serve low-income, first-generation, and students with disabilities as we enter the second quarter of the 21st century. My previous blog post demonstrated the effectiveness of TRIO programs and how they may be used to address such challenges.
High and Increasing Levels of Inequality in the USA are a Challenging Context of TRIO’s Work. Figure 1 displays the shares of income by household income quintiles in 1967, around the time TRIO programs were first initiated, and in 2022. This data reveals high levels of inequality in both 1967 and 2022, with increasing inequality over the period. The distribution shows extremely low household income percentages for the students that TRIO is designed to serve. By 2022, the bottom 20% of households lived on 3% of total household income (down from 4% in 1967), and the second-from-bottom quintile lived on 8% (down from 11% in 1967). In 2022, the lowest quintile had a mean income of $16,120, and the highest quintile had a mean income 17 times higher, of $277,300 (Tax Policy Institute, 2024).
Figure 1. Shares of United States household income by quintiles: 1967 and 2022: (Indicators (STS Figure 8c)
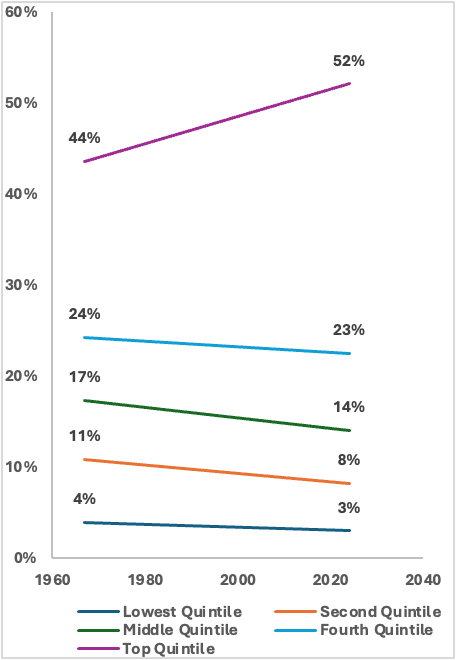
Source: U.S. Department of Commerce, U.S. Census Bureau, Current Population Survey (CPS) Table A-4 Selected Measures of Household Income Dispersion: 1967-2023. Retrieved from https://www.census.gov/data/tables/time-series/demo/income-poverty/historical-income-inequality.html
Decline in Pell Grant Coverage of College Costs. Both the 1967 and 2022 household income distributions reveal dauntingly high levels of inequality; however, when the income distribution data are combined with decreases in Pell Grant purchasing power (Figure 2), the situation faced by low-income families vis-à-vis college becomes increasingly challenging. In the first decade after Pell Grants were established, the maximum Pell Grant was designed to cover about 2/3 of average college costs (Mensel, 2013). By 2022-23 the maximum Pell Grant level had fallen to cover 25% of average costs, down from 67% in 1980.
Figure 2. Percentage of average costs (tuition and required fees plus room and board) covered by the maximum Pell Grant: 1974-75 to 2022-23 (Equity Indicator 3b(ii))
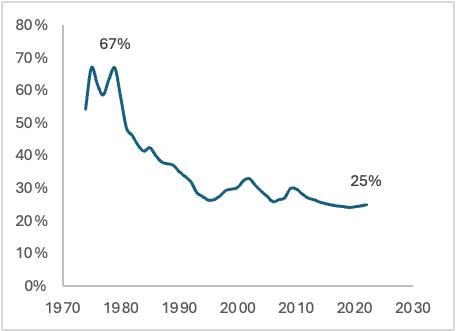
SOURCE: Ma and Pender (2025). Trends in College Pricing and Student Aid, New York: College Board as updated and analyzed by author.
Enrollment Declines. Reflecting these growing economic challenges, after decades of growth, postsecondary enrollment among 18–24-year-olds has declined over the last decade. As Figure 3 shows, declines are concentrated in the bottom two family income quartiles. This is indicative of the fact that the possibility of college for many low-income students in the United States has become increasingly out of reach.
Figure 3. Cohort College Participation Rates by family income: quartile for dependent 18- to 24-year-olds: 1970 to 2022 (Equity Indicator 1a)
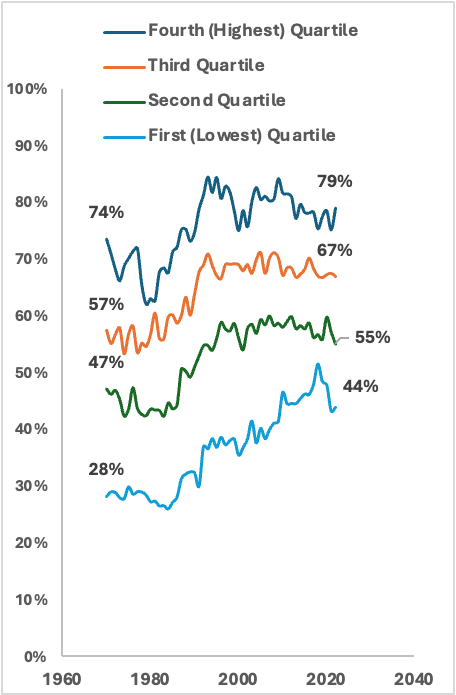
SOURCE: U.S. Census Bureau, 1974-2022, as compiled by Tom Mortenson and Nicole Brunt using October Current Population Survey School Enrollment Supplement historical data sets and online extraction tool, MDAT, https://data.census.gov/mdat/#/.
International Growth in Higher Education Enrollment and Attainment. In a period when the United States is experiencing slower growth and some declines, higher education worldwide has seen large increases (UNESCO Institute for Statistics, 2025). Figure 4, based on Equity Indicator 6a, displays Organization for Economic Cooperation & Development (OECD) data for 2002 and 2022 on bachelor’s degree attainment for adults aged 25 to 34 for the top ten countries in bachelor’s degree attainment in 2022, and for the United States and the OECD average.
Figure 4. Percentage of adults 25 to 34 with a type A tertiary degree (bachelor’s or above): 2002 and 2022 (Based on data from Equity Indicator 6a)
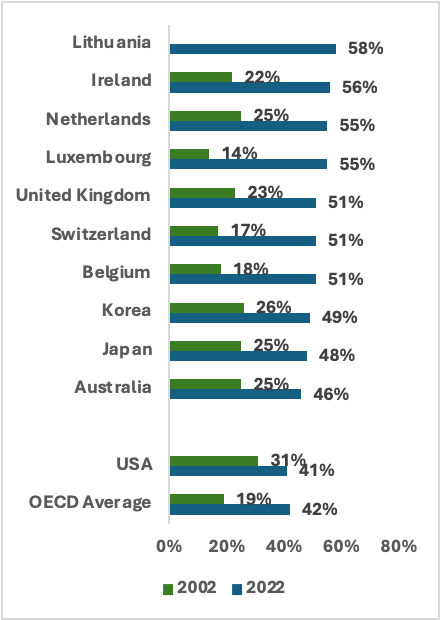
Source: (OECD, 2023), Education at a Glance Analysis by Author.
The data reveal that each of the countries included in the top ten chart was far below the United States in 2002 and had moved ahead of the United States by 2022. The full data set of 38 countries reveals that the United States fell from second in 2002 to 18th in 2022.
The countries shown in Figure 4 have diverse higher education histories; but early in the 21st century, they articulated national goals for widening participation and subsequently increased public investment in higher education. These investments include special outreach to low-income and non-traditional students, free or almost free tuition, or completion incentives such as loan forgiveness (Cahalan & Brunt, 2025). This is consistent with Article 13 of the International Covenant of Cultural, Economic and Social Rights, now signed and ratified by 173 nations, which affirms the universal human right to higher education and calls for the progressive introduction of free higher education. In contrast, the United States has seen increases in the percentage of costs paid by students and their families, up to 46% in 2022 (Equity Indicator 4a(i)). This situation has created a student debt crisis.
The rapid increase in higher education worldwide should be applauded in an interdependent global age. As the UNESCO publication on the Right to Higher Education, A Social Justice Perspective affirms, there is a need for a new win-win higher education paradigm in which gains for one group, state or country do not mean lessor gains for another group, state, or country (Sabzalieva et al., 2022).
Hopefully, as the right to higher education becomes increasingly recognized in the United States, there will be an increase in both our national and state investments in support of higher education, especially for those families with incomes in the bottom two quartiles of our nation. This is especially needed in the information economy of the 21st century. Increased public support is needed to ensure the attainment of TRIO’s congressionally mandated mission to ensure that all low-income, first generation and students with disabilities will have the opportunity and support for full global citizenship participation in the 21st century; and to ensure that each person has access and support to develop their own talents to the fullest.
References
Cahalan, M. W., & Brunt, N. (2025). Beyond the rankings: Comparing postsecondary policies around the globe. Raburn Office Building Hill Brieifing, Washington, D.C.
Cahalan, M. W., Brunt, N., Vaughan, T., III, Montenegro, E., Breen, S., Ruffin, E., & Perna, L. W. (2024). Indicators of higher education equity in the United States 2024: 50-year historical trend report. https://www.pellinstitute.org/the-indicators-of-higher-education-equity-in-the-united-states-2024-50-year-historical-trend-report/
Ma, J., & Pender, M. (2025). Trends in college pricing and student aid. College Board. https://research.collegeboard.org/trends/college-pricing
Mensel, F. (2013). Birth of the Pell Grant: The community college role. In Reflections on Pell. Pell Institute for the Study of Opportunity in Education – Council for Opportunity in Education.
OECD. (2023). Education at a glance. OECD Publishing. https://www.oecd.org/en/publications/2023/09/education-at-a-glance-2023_581c9602.html
Sabzalieva, E., Gallegos, D., Yerovi, C., Chacon, E., Mutize, T., Morales, D., & Cuadros, J. (2022). The right to higher education: A social justice perspective. UNESCO. https://unesdoc.unesco.org/ark:/48223/pf0000381750
Tax Policy Institute. (2024). Statistics: Household income quintiles [Dataset]. Urban Institute & Brookings Institution. https://taxpolicycenter.org/statistics/household-income-quintiles
UNESCO Institute for Statistics. (2025). UNESCO education statistics [Dataset]. https://data360.worldbank.org/en/dataset/UNESCO_UIS
Margaret Cahalan is a Senior Research Fellow of the Pell Institute. All views expressed in this Blog Post are the full responsibility of the author and do not represent those of the Pell Institute or the Council for Opportunity in Education.